AS CHAKRAVARTHY NCFM ACADEMY HYDERABAD
Phone : +91 9848960767 / 9573157595.


About BAR CHARTS : Technical Analysis Training in Hyderabad
|
Stock Market Courses in Hyderabad : AS Chakravarthy NCFM Academy
ASC NCFM Academy Hyderabad is the Best Advanced Technical Analysis Course Training Institute in HyderabadAS Chakravarthy NCFM Academy Hyderabad, Ameerpet is Best Institute in Technical Analysis Training in Hyderabad, Online Stock Market Trading Training in Hyderabad - in Telugu, NCFM, NISM Courses like Capital Market Dealers Module, Equity Derivative Certification Examination (NISM-8), Commodities Market Module, Technical Analysis Module, Fundamental Analysis Module, NSE Certification Courses and NISM Certification Courses.
BAR CHARTS IN TECHNICAL ANALYSIS :
The bar chart (High-Low-Closing Chart) Analysis is a very popular method in Technical Analysis.
And another bar chart (Open-High-Low-Closing Chart) Analysis is also a popular method in Technical Analysis.
In this bar chart, High-Low-Closing prices of the day are plotted on a day-today basis in the form of a bar.
The top of the bar would represent the high price of the day the bottom of the bar would represent the low price of the day and a small horizontal hash on the right of the bar would represent the closing price of the day, and we plotted another horizontal hash to the left-hand side of the bar as opening price of the day.
Bars are basically divided into two types, One is Upward Bar and the other one is Downward Bar, I have shown below:-
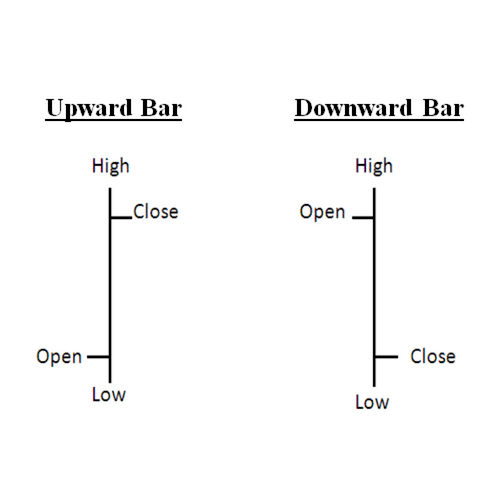
Stcok Market Training Institute in Hyderabad : AS Chakravarthy Academy
TO KNOW OUR NISM - NCFM Courses Training Institute in Hyderabad. Please Visit AS Chakravarthy NCFM Academy Hyderabad : Stock Market Training Institute in Hyderabad. Bar Charts in Technical Analysis : ASC NCFM Academy Hyderabad is the best institute in Ameerpet.
AS Chakravarthy NCFM Academy Hyderabad is the best for